Salt Lake City Water and Sewer Infrastructure
Capital investments are necessary to ensure utility infrastructure sustainability.
April 27, 2007
|
Since this early beginning, the City’s water and sewer systems have continued to expand. In 2005, the water distribution system consisted of 1408 miles of pipe; and the sewer collection system 616 miles of pipe.
Nationally, aging infrastructure is becoming a serious problem. It is estimated that water and wastewater utilities will have to invest hundreds of billions of dollars over the next 20 years to keep up with deteriorating systems. The Department of Public Utilities (DPU) is addressing its aging infrastructure with a water and sewer pipe replacement and rehabilitation program.
On June 10, 1997 the City Council approved a 5-year, $45.3 million capital improvement program. A key component was a water main and sewer main replacement program, replacing or rehabilitating 0.6 percent of the systems each year.
After the initial 5-year program, the City Council has continued to fund the water and sewer main program on a 2-year basis. The replacement goal has been increased to1.0 percent per year.
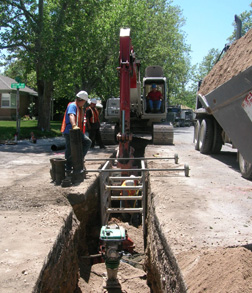
Since 1997, the DPU has replaced 472,765 linear feet of water mains and rehabilitated 313,659 linear feet of sewer pipe with Cured-In-Place-Pipe (CIPP). This amounts to 149 miles of pipe improvements.
In 2006 a special improvement district was formed by Salt Lake County to improve fire protection in the Mill Creek area. Nearly 100,000 feet of pipe was replaced under this SID and is included in the tabulation.
Currently negotiations are underway with mutual irrigation companies located in the corporate boundary of the City of Holladay, which will replace and upgrade the water systems in this area served by DPU.
Water main replacement & Sewer main rehabilitation costs
The cost of replacing water mains is increasing at a rate faster than inflation. The cost to replace an 8-inch water main increased from $31.89 to $96.28 per linear foot of pipe in 2006; increasing 2.66 times faster than the rate of inflation since 1986.
|
Benchmarks
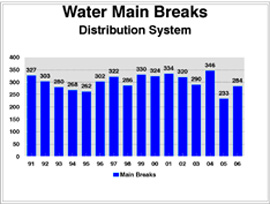
1- Number of miles of pipe per one break. The DPU is better than the national average. The AWWA national average is 1 break/3.7 miles of pipe. The regional value is 1 break/4.1 miles of pipe. DPU value in 2006 is 1 break/4.8 miles of pipe.
2- Percentage of pipe system replaced per year. Again DPU is better than the national average. The AWWA benchmark is 0.6 per cent per year nation-wide and 0.9 percent regionally. DPU over the last 3 years has been 0.65 percent, just above the national average and still below the regional average. The goal is now 1.0 percent.
Pipe Replacement/Rehabilitated/Year Footage Tabulation
| Utility |
96-97 |
97-98 |
98-99 |
99-00 |
00-01 |
01-02 |
02-03 |
03-04 |
04-05 |
05-06 |
06-07 |
Total |
| Water |
4122 |
38128 |
40266 |
38224 |
61378 |
37483 |
51566 |
57176 |
27208 |
42214 |
75000 |
473K |
| Sewer |
3687 |
14697 |
8773 |
16949 |
19083 |
11748 |
18830 |
64884 |
56717 |
52591 |
46000 |
314K |