GIS Leads Public Utilities into the Future
January 20, 1999
History – Early Records
|
Traditionally, water, sewer and stormwater infrastructure was surveyed and the notes transcribed onto paper maps. Prior to adopting GIS, water system new construction information was drafted onto drawings. Water maps were 22 inches by 34 inches at a scale of 1 inch = 100 feet. Likewise, the sewer information was drafted onto maps that were approximately 12 inches x 20 inches in size. The sewer book maps were at a scale of 1 inch = 60 feet. The sewer maps cover the corporate limits of Salt Lake City and the water maps the City and unincorporated eastern Salt Lake County, where the City provides water service.
Birth of GIS
In 1991 the City’s stormwater (drainage) program was transferred to the Department of Public Utilities and made an enterprise utility, financed by user fees. Mapping of the drainage system was required because the user fees were based on impervious (hard) surfaces on each property parcel. Aerial photos and GIS technology was used to measure these "impervious” areas on commercial and industrial sites. The original commercial and industrial areas were digitized from 100-foot aerial photographs. This showed the buildings and pervious (landscaped) areas for each parcel. With the completion of this project, the decision was made to include the mapping of the water and sewer systems on GIS.
How GIS is Created
Scanning in traditional 22x34 inch water maps created GIS. The maps are then attributed to give each independent segment of pipe a unique identification (“IDs”). This allows for information to be tied to any unique item from other sources; such as history information, billing information, type, size and material. This is a huge project since the Department maintains over 1,300 miles of water mains. Next, each map is moved to the correct coordinate system, checked for correct ties and annotated to show service lines, street, tie, stationing, fire hydrants and miscellaneous information.
The sanitary sewer system was digitally created by manually inputting each page from each sewer map book. These maps are also attributed with unique IDs. The sewer laterals, offset information and sewer location stations are added from an AutoCAD system, then converted to GIS coverage. Manhole depth and flow-line profiles had to be manually added to the GIS maps.
“Record” drainage system drawings were not available, so new maps for these facilities had to be generated. The storm drain system is being mapped using a global positioning system (“GPS”), which allows field data to be captured with attribute information in the correct coordinate system. Because the drainage system does not have good historic records, maintenance personnel are accompanying GIS personnel, equipped with the GPS, into the field and locating all of the drains and related facilities. With the completion of the drainage system, all 3 utility systems will be on GIS.
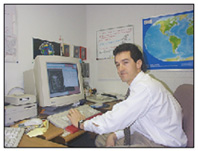
GPS is also being used to locate water meter installation locations. “The GPS has really increased efficiency,” says Mr. Kryger adding, “Because surveying new meter installations was not a high priority, we were behind on 3,500 new meter installation locations. Since acquiring the GPS, we have caught up with the backlog, and have located 800 more since July ‘98.”
The Advantages of GIS
According to Mr. Kryger, “GIS creates smart maps, or maps with information tied to them.” Enormous amounts of information can be stored onto computer files. Digital data can also be brought up to date faster and more accurately. Using GIS to manage and tie this data to a geographical feature can save time and money. Additionally, it provides accurate information that allows for more flexibility in its use. Many different analyses can be performed; for example, data can now be overlaid onto a single map to show possible conflicts between the utilities. Important information can be acquired by selecting certain attributes; such as selecting the pipes over 50 years of age, or identifying segments of pipe that have more than 5 main breaks, etc. This, according to Mr. Kryger, is one of his division’s greatest challenges. He says, “The more we do, the more our customers like it, resulting in them requesting more information.” He adds, “It’s growing exponentially with each new application.”
GIS’s Future
Mr. Kryger sees a bright future for GIS as its full potential is realized. Some day, by simply logging onto the Internet, individuals can find information about the utility infrastructure. Maintenance employees will be able to see information on screens located within their vehicles, which will save time and money in the performance of their duties. For example, a maintenance employee may need to make a water shut down, but the valves are covered with snow. The employee, by using a laptop computer, could call up the map and determine the valve locations by station measurement, as well as by a picture of exactly where the valves are located. A list of all customers affected by the shut down could be created for easy notification of the shut down.
|
Questions about this article should be directed to Nick Kryger at 801- 483-6834 or by e-mail: nick.kryger@slcgov.com

