I often use the analogy of the Indianapolis 500 Race when trying to stress the need for utility capital investments. No matter how determined, skilled and dedicated the driver, if the racing car is not competitive, the driver will fail to win the race. This is also true about providing superior water, wastewater and stormwater services. If the systems are not competitive, no matter how hard our employees try, they will fail to win in providing superior utility services to our customers. Utility systems are capital intensive, requiring on-going capital investments in order to perform properly. Systems have to be replaced because of age, upgraded because of new and more stringent standards and expanded to meet the growth needs of the community. Not only is it important to invest in capital improvements, it's equally important to adequately maintain existing systems. |
 |
During this decade infrastructure and financing have been the top priorities. We are committed to quality products and services, continuous improvement and satisfying our customers. However, we realize that this is only possible if the Department is adequately financed and there is a commitment to replace aging infrastructure and upgrade utility facilities to meet higher levels of performance. Described as a "Silent Crisis," a May 24, 1996 Deseret News article reported that "Politicians say it's hard to justify spending funds on a problem you can't see." However, a year later, after making a detailed study of the matter, the City Council made a strong commitment to solve the problem by adopting a far sighted 5-year capital improvements program and annual rate increases to finance it.
On July 1, 1997 the City Council approved a 5-year, $45.5 million water capital improvements program and a 5-year series of rate increases to insure adequate funding. This was a landmark decision, making it possible for the first time to plan a capital improvement program with the assurance that it would be funded. The plan included replacing aging watermains and distribution reservoirs, upgrading dams and water treatment plants and developing new wells. During the past fiscal year the Department expended $19.9 million in meeting its construction schedule.
The Department met the goal of replacing 38,000 feet of watermains. The 15th East and Samual Park Reservoirs have both been rebuilt and are in service. Mt. Dell and Twin Lakes dams have been brought up to State safety standards and a study of Lake Mary - Phoebe dam was started during the fiscal year. The Big Cottonwood Water Treatment Plant was under reconstruction during the year and will be completed early in 1999. The Mill Creek Well was drilled and is a good producing well. We have been heavily involved in the I-15 reconstruction and Light Rail projects.
During the fiscal year the Department did not violate any federal or state regulation or standard required under the Safe Drinking Water and Clean Water Acts.
The Department was one of the first in the nation to participate in the American Water Works Association ("AWWA") QualServe program. This was an extension of the Department's Total Quality efforts, taking continuous improvement, efficiency, quality and customer satisfaction one step further. The program is specifically geared to the water utility profession. Ninety-seven employees participated in the self-assessment on October 19, 1997. A self-assessment report was prepared by AWWA and provided the Peer Review Team a basis for their review held November 16-19. On the last day of the review, the team submitted their report, noting both strengths and opportunities for improvement. The Department both appreciated their recommendations, and as a first step, focused on four points: communications with employees, employee training, information systems and updating policies and procedures.
Recognizing that becoming competitive is part of the Department's efforts to provide quality products and services to its customers, Department employees attended various seminars on benchmarking and becoming competitive. A 6-member team attended the AMSA/AMWA "Thinking, Getting and Staying Competitive" seminar during the spring of 1998.
I’d like to express my gratitude and thank all the employees who made this past year such a success. It’s through their efforts that as an organization we have accomplished so much.
Accomplishments
Safety Award
The Water Utility received a Safety Award from the American Water Works Association for having "One-fourth, (or less than) the Utility Industry Average Severity Rate." Nothing is more important than safety in the work place.
Water Reclamation
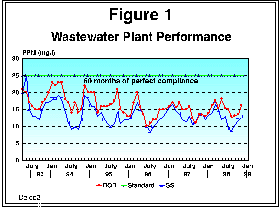
The Wastewater Treatment Plant continued its outstanding performance during the past year. At the end of 1998, the plant will have operated for 64 consecutive months without a permit violation (See Figure1). The Reclamation Plant and employees received the 1998 EPA Region VIII O&M Award on August 27, 1998. At the award presentation ceremony, Region VIII Assistant Administrator Steve Tuber praised the plant's efficiency and commitment to clean water, and noted that the wetland project shows the City's clear commitment to the environment. |
 |
The Plant also received an AMSA Gold Award for its 1997 perfect compliance performance. Jon Adams, Wastewater Manager, summed up the challenges involved in earning these awards by saying, "We have been through much turmoil on the path of success… " He added, "We have done all this while the organic loading to the plant has doubled, yet we have produced the highest quality effluent in the plant's history." At the end of December, the plant will be eligible for the Association of Metropolitan Sewage Agencies "Platinum Award."
The Laboratory earned, for the fourth consecutive year, the "Outstanding Laboratory" Award, and the Pretreatment Program the 1997 "Outstanding Pretreatment" Award from the WEF Utah Chapter.
Drinking Water Programs
The water treatment plants have been producing superior drinking water, far exceeding federal drinking water standards. As a result of the 1993 Milwaukee Cryptosporidium episode, we and our suppliers, the Metropolitan Water District of Salt Lake City and Salt Lake County Water Conservancy District, voluntarily began operating our treatment plants to produce filtered water at the highest quality possible. Our records show that finished water quality has improved by reducing the turbidity after filtration from an average 0.08 NTUs before to 0.04 NTUs after implementing the voluntary standard in November 1994. The plant operators are to be commended for their excellent response to this new microbial threat. For this effort, the State Drinking Water Board presented Salt Lake City Public Utilities and the Alliance its 1997 Achievement Award, "For Their Cooperative Effort to Achieve the Highest Possible Standards of Water Treatment."
Valley-wide ground water protection has been implemented with passage of the Ground Water Source Protection Ordinance. Florence Reynolds, along with other members of the Salt Lake Valley Ground Water Protection Coalition, received the EPA Environmental Achievement Award for "Outstanding Development of a County-wide Drinking Water Source Protection Ordinance."
Watershed protection was furthered this year, by revisiting the City’s 1988 Watershed Management Plan. In summary, the main points derived from updating the plan include the need to 1.) develop sound scientific data, 2.) increase the Watershed and Water Rights Purchase Fund, and become more aggressive in acquiring watershed property, 3.) implement a watershed education program and 4.) develop a stronger partnership with the United States Forest Service and our congressional delegation. The revised '98 Plan will be taken to the City Council during early 1999.
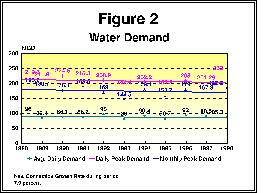
In 1995, the City Council approved a new rate structure to manage peak demand on the water system in order to defer the need for new treatment and conveyance capacities. Concurrently there has been a growing need for water conservation. Since 1988 water usage and peak demand trends have been flat, if not slightly downward (See Figure 2); this despite the fact that 6,600 new connections (7.9 percent increase) have been added to the system over this period of time. |
 |
Operations and Maintenance Programs
Operationally we have met our customer’s needs during the past year. Stormwater crews got us through the run-off period without any flooding. Operations and Maintenance crews have performed in an exemplary manner, meeting nearly all of their performance standards during the year (See Performance Data). The Water Distribution division completed a sanitary survey of the water system using the State's format and as a follow up to the 1995 State survey. The number of complimentary letters and comments continue to show customer satisfaction. Customer Service surveys show that overall, the Department is satisfying its customer’s needs.
Fire Insurance Rating
Insurance Services Office (ISO) conducted a fire insurance rating during FY 1997-98. Salt Lake City's insurance rate was maintained at a Class 2. This is an excellent rating with a substantial portion of the rating attributed to the water system.
Financial Ratings
Financially the Department is sound. The Department’s stand-alone AA bond rating and bond coverage demonstrates the strength of the three utility funds. The multi-year CIP and planned water rate increases guarantee the success of the water utility until the year 2002. Bond Coverage for FY 1997-98 was 3.44 for all three utilities combined, much greater than the required 1.25. Total net operating income increased from $6.66 million in FY 1996-97 to $7.5 million in FY 1997-98 for all three funds, attributed to the water rate increase on July 1, 1997. Capital Improvements amounted to $19.9 million during FY 1997-98 down from $24.4 million the previous year. The Department received an excellent outside audit report by Price WaterHouse and Coopers. Sewer rates will need to be adjusted in the near future to maintain this utility’s financial strength.
Water Rights
On March 27, 1998, the Department successfully acquired the water rights of the Brown and Sanford Irrigation Company amounting to 10.42 percent of the primary rights in Big Cottonwood Creek.
After 24 plus years the Department completed the final step of the Spiro Tunnel lawsuit (Civil No. 148,376) with United Park City Mines. The State Engineer, on June 26, 1998 approved Change Application a18808, allowing Salt Lake City to divert water from the Ontario Tunnel to points that the City can beneficially use the water. This was accomplished by trading City owned water in Spiro Tunnel, which flows to the Weber Basin, for an equal amount (about 1,500 acre-feet) of water in the Ontario Tunnel, which flows to the Utah Lake - Jordan River Drainage. The approved Change Application now provides the City the right to divert and use the water gained from the lawsuit.
Litigation over water rights has been a major effort over the past several years. Defending the City’s water rights has been, and will continue to be, the top administrative priority.
Environmental Stewardship
In 1995, fearing that the Bonneville cutthroat trout could become extinct, Utah Division of Wildlife Resources biologists sought out and were successful in locating a pure strain of the fish above Little Dell Reservoir and in Mt. Dell Reservoir in Parleys Canyon. In an effort to increase the population, eggs were collected and fingerlings were grown in facilities provided by the operators of the Parleys Water Treatment Plant. Twelve hundred cutthroats were released into Lambs Canyon stream in the spring of 1996. In restoring this native fish to its former habitat, the Department made a significant contribution to wildlife conservation. This effort was continued in 1998, when the Department partnered as a co-sponsor with Trout Unlimited in a grant to improve Dell Creek as a fishery and contributed $10,000 of in-kind help. Secretary Babbitt hailed the effort during an on-site press conference during the spring of 1998.
Challenges
Perhaps the most pressing challenge this coming year will be the Metropolitan Water District of Salt Lake City's ("MWD") Master Plan and its impact on the Water Utility Fund. When completed, the cost is expected to exceed $200,000,000. Wholesale water rate increases are planned for early 1999. There may also be tax increases in the future. Equity between City ratepayers and County ratepayers will be a major issue, particularly if rates are raised beyond what is planned this coming year. County rates are based on a formula used by the Public Service Commission ("PSC"). Although we are not under the PSC, we use the same formula as a basis for setting rates. The rate increases planned by MWD will exceed that amount that can be charged under the formula; therefore, we must come up with a way of increasing the pass-through rates equally to both city and county customers. Also at question is the impact on the already approved water Capital Improvement Program for system replacements in light of the anticipated MWD increases. This will be a major issue this coming year.
Watershed protection and maintaining high quality-drinking water continues to be one of the greatest challenges facing the Department. Implementing the 1998 Canyon Master Plan, forging stronger partnerships with other governmental agencies and dealing with ski resort expansion plans top the list of work items.
In 1999, the Department will begin the process of developing and financing the City’s wastewater facilities program. The current 20-year plan, approved in late 1982, is near its end and a new plan must be developed for the next 20-year planning period. A companion financial plan and sewer user rate increase will be necessary to meet the 21st century needs of this utility.
Another challenge will be the external construction programs now going on within the City. Airport expansion, west to east light rail, I-15 reconstruction, the Olympics and other projects will impact the Department during the coming year.
The Department will have to comply with new regulatory requirements this coming year; such as: 1.) EPA Report Card, 2.) State required conservation plan and 3.) the EPA Stage l Microbial and Disinfection Byproducts Rule.
Water Rights will continue to be a challenge during the coming year. Negotiations with mutual irrigation companies to deal with the urbanization of Salt Lake County will continue to be an issue.
Changes in government could be a challenge this coming year. The incorporation of new cities in a portion of Salt Lake City’s water service area in unincorporated Salt Lake County is a strong possibility during 1999. Salt Lake County is moving towards a new form of government, and this could have an affect on the Department.
Organizationally we will strive to be efficient and competitive. Our participation in the AWWA QualServe program, total quality, and the water industry's efforts to become competitive in light of the privatization movement in the United States will be a major challenge this coming year.
In closing, I’m looking foreword to the coming year, and with the help of the dedicated and skilled employees of the Department, I hope as in the beginning of this report, that we are able to provide the competitive racing car for them to win the race for quality products and services.
Awards and Ratings Summary
- 1997 AMSA Gold Award for Perfect NPDES Permit Compliance
- 1998 Region 8 EPA Excellence Award for O&M Management of a POTW
- 1997 WEF Utah "Outstanding Laboratory" Award
- 1997 WEF Utah "Outstanding Pretreatment Program" Award
- 1997 Utah Drinking Water Board Achievement Award
- 1998 EPA Achievement Award to Florence Reynolds for Ground Water Protection Ordinance
- 1998 Ground Water Protection Conference Excellence Award
- 1997 AWWA Safety Award
- Standards & Poors and Moody's stand-alone AA Bond Rating
- Insurance Services Office Class 2 Fire Insurance Rating
Operations & Maintenance Performance Data
Key Indicator |
FY 1994-95 |
FY 1995-96 |
FY1996-97 |
FY1997-98 |
Emergency Responses |
5,287 |
5,720 |
6,038 |
5,175 |
Distribution Responses |
892 |
972 |
840 |
653 |
Water Pressure Complaints |
270 |
441 |
361 |
274 |
Water Quality Complaints |
159 |
108 |
82 |
118 |
Work Orders Issued |
25,198 |
34,888 |
54,510 |
56,601 |
Main Breaks |
262 |
302 |
322 |
286 |
Service line Repairs |
939 |
1,040 |
1,192 |
1,190 |
Service line Replacements |
727 |
559 |
497 |
472 |
Fire Hydrants Repaired |
960 |
940 |
417 |
400 |
Fire Hydrants Replaced |
49 |
58 |
46 |
68 |
Valves Operated |
11,679 |
8,476 |
8,520 |
8,645 |
Valves Replaced/Repaired |
531 |
292 |
285 |
294 |
Hydrants Flushed |
4,480 |
3,920 |
4,483 |
657 |
Washout Valves Flushed |
515 |
807 |
1,496 |
493 |
Sewer lines Cleaned (miles) |
190 |
221 |
276 |
202 |
Sewer lines TV'd (miles) |
14.5 |
15.7 |
25.4 |
21.3 |
Sewer Manholes |
2,559 |
1,385 |
1,202 |
1,204 |
Sewer Lateral Calls |
137 |
116 |
271 |
236 |
Cross Connection Backflow Test Reports |
1,799 |
1,463 |
1,913 |
2,483 |
Avg. Daily Demand (mgd) |
80.6 |
92.0 |
88.5 |
85.3 |
Max. Peak Month (mgd) |
158.7 |
179.0 |
167.9 |
182.8 |
Max. Peak Day (mgd) |
185.2 |
208 |
201.3 |
233 |
Total Supply to Conduits |
101,417 af |
104,389 af |
99,526 af |
95,584 af |
Drinking Water Treatment Plant Performance Data
Key Indicators |
FY 1994-95 |
FY 1995-96 |
FY1996-97 |
FY1997-98 |
Exceeded 0.1 NTU limit Data From All Plants |
6 |
0 |
0 |
2 |
Finished Turbidity Big Cottonwood Parleys City Creek |
NTUs 0.03 0.065 0.03 |
NTUs 0.026 0.06 0.03 |
NTUs 0.029 0.039 0.02 |
NTUs 0.027 0.035 0.025 |
Big Cott'wd Cost/ac-ft Parleys Cost/ac-ft City Creek Cost/ac-ft |
$34.72 $99.7 $99.51 |
$ 40.04 $119.81 $ 82.71 |
$ 47.87 $101.77 $ 98.90 |
$ 84.55 $ 97.32 $128.63 |
Deep Well Performance Data - 1997
Well Name |
Total Cost - not including depreciation |
Acre-feet pumped |
Cost/acre-foot |
4th Avenue Well |
$ 36,673 |
588.09 |
$ 62.36 |
500 South 1500 East Well |
$ 45,361 |
891.77 |
$ 50.87 |
Sugar House Park Well |
$ 7,271 |
None |
N/A |
1300 East 2700 South Well |
$ 39,521 |
1,567.24 |
$ 25.22 |
1900 East 2700 South Well |
$ 64,576 |
1,669.19 |
$ 38.69 |
Mill Creek Well |
$ 413 |
None |
N/A |
Brinton Spring Well |
$ 27,677 |
801.61 |
$ 3 4.53 |
4800 South Well |
$ 11,977 |
574.34 |
$ 2 0.89 |
Edgewood Well |
$ 17,635 |
524.63 |
$ 33.61 |
Diagonal Well |
$ 9,565 |
268.29 |
$ 35.65 |
Fontaine Bleu Well |
$ 36,845 |
296.41 |
$124.30 |
6200 South Well |
$ 56,710 |
1,061.24 |
$ 53.44 |
Upper Ellison Well |
$ 38,171 |
561.53 |
$ 67.98 |
Dyers Inn Well |
$ 5,428 |
None |
N/A |
Greenfield Village |
$ 15,536 |
252.72 |
$ 61.48 |
Little Cottonwood Well |
$ 188 |
142.29 |
$ 1.32 |
Walker Lane Well |
$ 21,768 |
493.67 |
$ 44.18 |
Nila Way Well |
$ 10,909 |
102.72 |
$106.20 |
2700 East Well |
$ 13,180 |
427.34 |
$ 30.84 |
Neffs Draw Well |
$ 10,314 |
178.83 |
$ 57.68 |
3281 South 3580 East Well |
$ 126 |
None |
N/A |
3280 South 3580 East Well |
$ 549 |
None |
N/A |
Artesian Basin #1 |
$ 3,360 |
272.55 |
$ 12.33 |
Artesian Basin #2 |
$ 4,022 |
387.10 |
$ 10.39 |
TOTALS |
$ 477,797 |
11,060.57 |
$ 43.20 |
Wastewater Treatment Performance Data
Key Indicators |
1995 |
1996 |
1997 |
1998 |
Plant Flow MGD |
36.2 |
37.33 |
36.50 |
40.1 |
Plant Loading BOD LBS/Day Plant Loading SS Lbs/Day |
60,115 54,678 |
57,592 45,793 |
58,745 38,656 |
65,696 53,236 |
Finished BOD (PPM) |
16 |
14.3 |
14.6 |
15.3 |
Finished SS (PPM) |
14.6 |
12 |
12.5 |
12.4 |
Contracts Office Performance Data
Key Indicators |
1994 |
1995 |
1996 |
1997 |
Number of Contracts |
100 |
144 |
75 |
106 |
Engineering Work Orders |
256 |
488 |
582 |
448 |
Total Permits |
1,185 |
1,384 |
1,304 |
811 |
Walk in Customers |
2,716 |
2,677 |
3,467 |
2,488 |
Letters (Buffer file) |
3,024 |
2,320 |
2,727 |
1,987 |
Customer Service Performance Data
Key Indicators |
1994 |
1995 |
1996 |
1997 |
Incoming Calls Calls lost Percent lost |
110,270 12,987 11.7.0% |
125,231 17,821 14.2% |
129,938 16,950 13.0% |
143,019 20,813 14.5% |
Walk in Customers |
29,329 |
17,956 |
35,085 |
33,399 |
Delinquent Accounts (No.) |
2,750 |
2,820 |
2,116 |
2,058 |
Service Terminations (No.) |
1,744 |
2,155 |
2,904 |
2,608 |
Water Assist Donations Water Assist Assistance |
$11,317 $4,867 |
$12,166 $7,197 |
$14,832 $7,971 |
$13,945 $13,945 |
Customer Satisfaction |
89.40% |
89.60% |
91.00% |
89.00% |
Financial Performance Data
Key Indicators |
FY 1994-95 |
FY 1995-96 |
FY1996-97 |
FY1997-98 |
Operating Income Water Utility Sewer Utility Stormwater Utility |
$24,386,993 $11,011,496 $ 4,832,713 |
$26,000,000 $11,000,000 $ 4,760,000 |
$28,292,885 $11,756,234 $4,848,967 |
$29,332,000 $10,948,552 $4,932,065 |
Net Income Water Utility Sewer Utility Stormwater Utility |
$3,444,267 $1,664,487 $1,991,614 |
$4,890,000 $1,640,000 $1,524,000 |
$3,705,400 $1,473,000 $1,391,000 |
$4,717,000 $1,236,300 $1,528,300 |
Capital Improvements Water Utility Sewer Utility Stormwater Utility Bond Coverage (1.25) |
$ 6.5 m $ 6.5 m $ 1.4 m 2.97 |
$ 7.2 m $ 6.4 m $ 4.9 m 3.36 |
$15.1 m $ 6.4 m $ 2.9 m 3.27 |
$14.3 m $ 3.36 m $ 2.24 m 3.44 |
Questions regarding this should be sent by e-mail to: leroy.hooton@ci.slc.ut.us