Water Use in Decline
December 21, 1998
|
At a recent Colorado River Water Users Association meeting held in Las Vegas, Jay Malonowski, representing the Metropolitan Water District of Southern California, said that his District has made major steps in conservation. The District provides approximately 60 percent of the drinking water used by nearly 16 million people living within a 5,200 square mile service area consisting of Los Angeles, Orange, San Diego, Riverside, San Bernardino and Ventura counties in southern California. Mr. Malonowski told those at the meeting that municipal water usage has decreased 39 percent from 2.8 million acre-feet in 1990 to 1.7 million acre-feet in 1998, while the population served increased by 400,000 people per year. He added, "millions of dollars have been spent to conserve water."
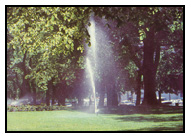
Likewise, between 1988 and 1998 growth in municipal water usage within Salt Lake City's service area has remained level, despite an 8 percent increase in new connections. This reduction in usage is attributed to greater public awareness regarding wise water use. Water conservation received greater attention during the 1990s. Political leaders advocated conservation. Likewise, newspaper editorials averred conservation. Conservation measures were incorporated into the Central Utah Project Completion Act signed by President Bush in late October 1991. The Salt Lake City Public Utilities Advisory Committee ("PUAC") passed a Water Use Ethic Resolution January 28, 1993 as a part of a 2 year water rate study. The PUAC recommended a peaking rate (higher rates during the summer months) to reduce summer peak demand that the City Council adopted by ordinance in 1995. Further, the City Council adopted new landscaping and planting requirements for new development that encourage water conservation.
The "Water Demand" chart (Figure 1) indicates the Average Daily
Demand, Monthly Peak Demand and Daily Peak Demand from 1988 to 1998. Applying
trend lines, all three parameters are flat, with a slight downward direction,
showing no increase despite an eight-percent increase in connections over
the same period. If there had not been a decrease, then one would
expect the usage to grow at the same rate as new connections. A
"trend" takes into account the year to year variations resulting
from weather, precipitation and temperature. It should be noted that the
1998 Peak Day consumption of 233 mgd was caused by operations, rather
than by true demand. If the number actually represent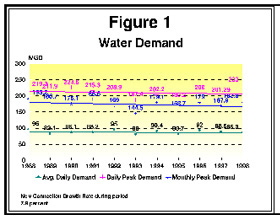 ed
the true peak day demand, the trend would be in a downward direction.
ed
the true peak day demand, the trend would be in a downward direction.
- The average daily demand over the 11-year period is 87.5 mgd
- The average peak monthly demand is 174.4 mgd, usually occurring during the month of July.
- The average peak day demand is 208.8 mgd.
Water rates are believed to be a major incentive to water conservation. Most western cities use water rates as a means of controlling water use. In most cases those areas that have the highest rates, experience lower per capita consumption. Salt Lake City still has rates among the lowest in the western United States. According to 1993 data, those with higher rates are usually among those with the lowest per capita consumption. For example Tucson had the lowest per capita use at 154 gal/d; Los Angeles 181 gal/d; San Diego 204; and Colorado Springs 179 gal/d.
Salt Lake City's usage was 269 gal/d for the same period (1993); but decreased 4.8 percent to 256 gal/d in 1997.
Questions regarding this article can be directed by e-mail to: leroy.hooton@ci.slc.ut.us